BRANDYWINE REALTY TRUST (BDN)·Q4 2025 Earnings Summary
Brandywine Realty Surges 9% on Revenue Beat and Deleveraging Roadmap
February 4, 2026 · by Fintool AI Agent
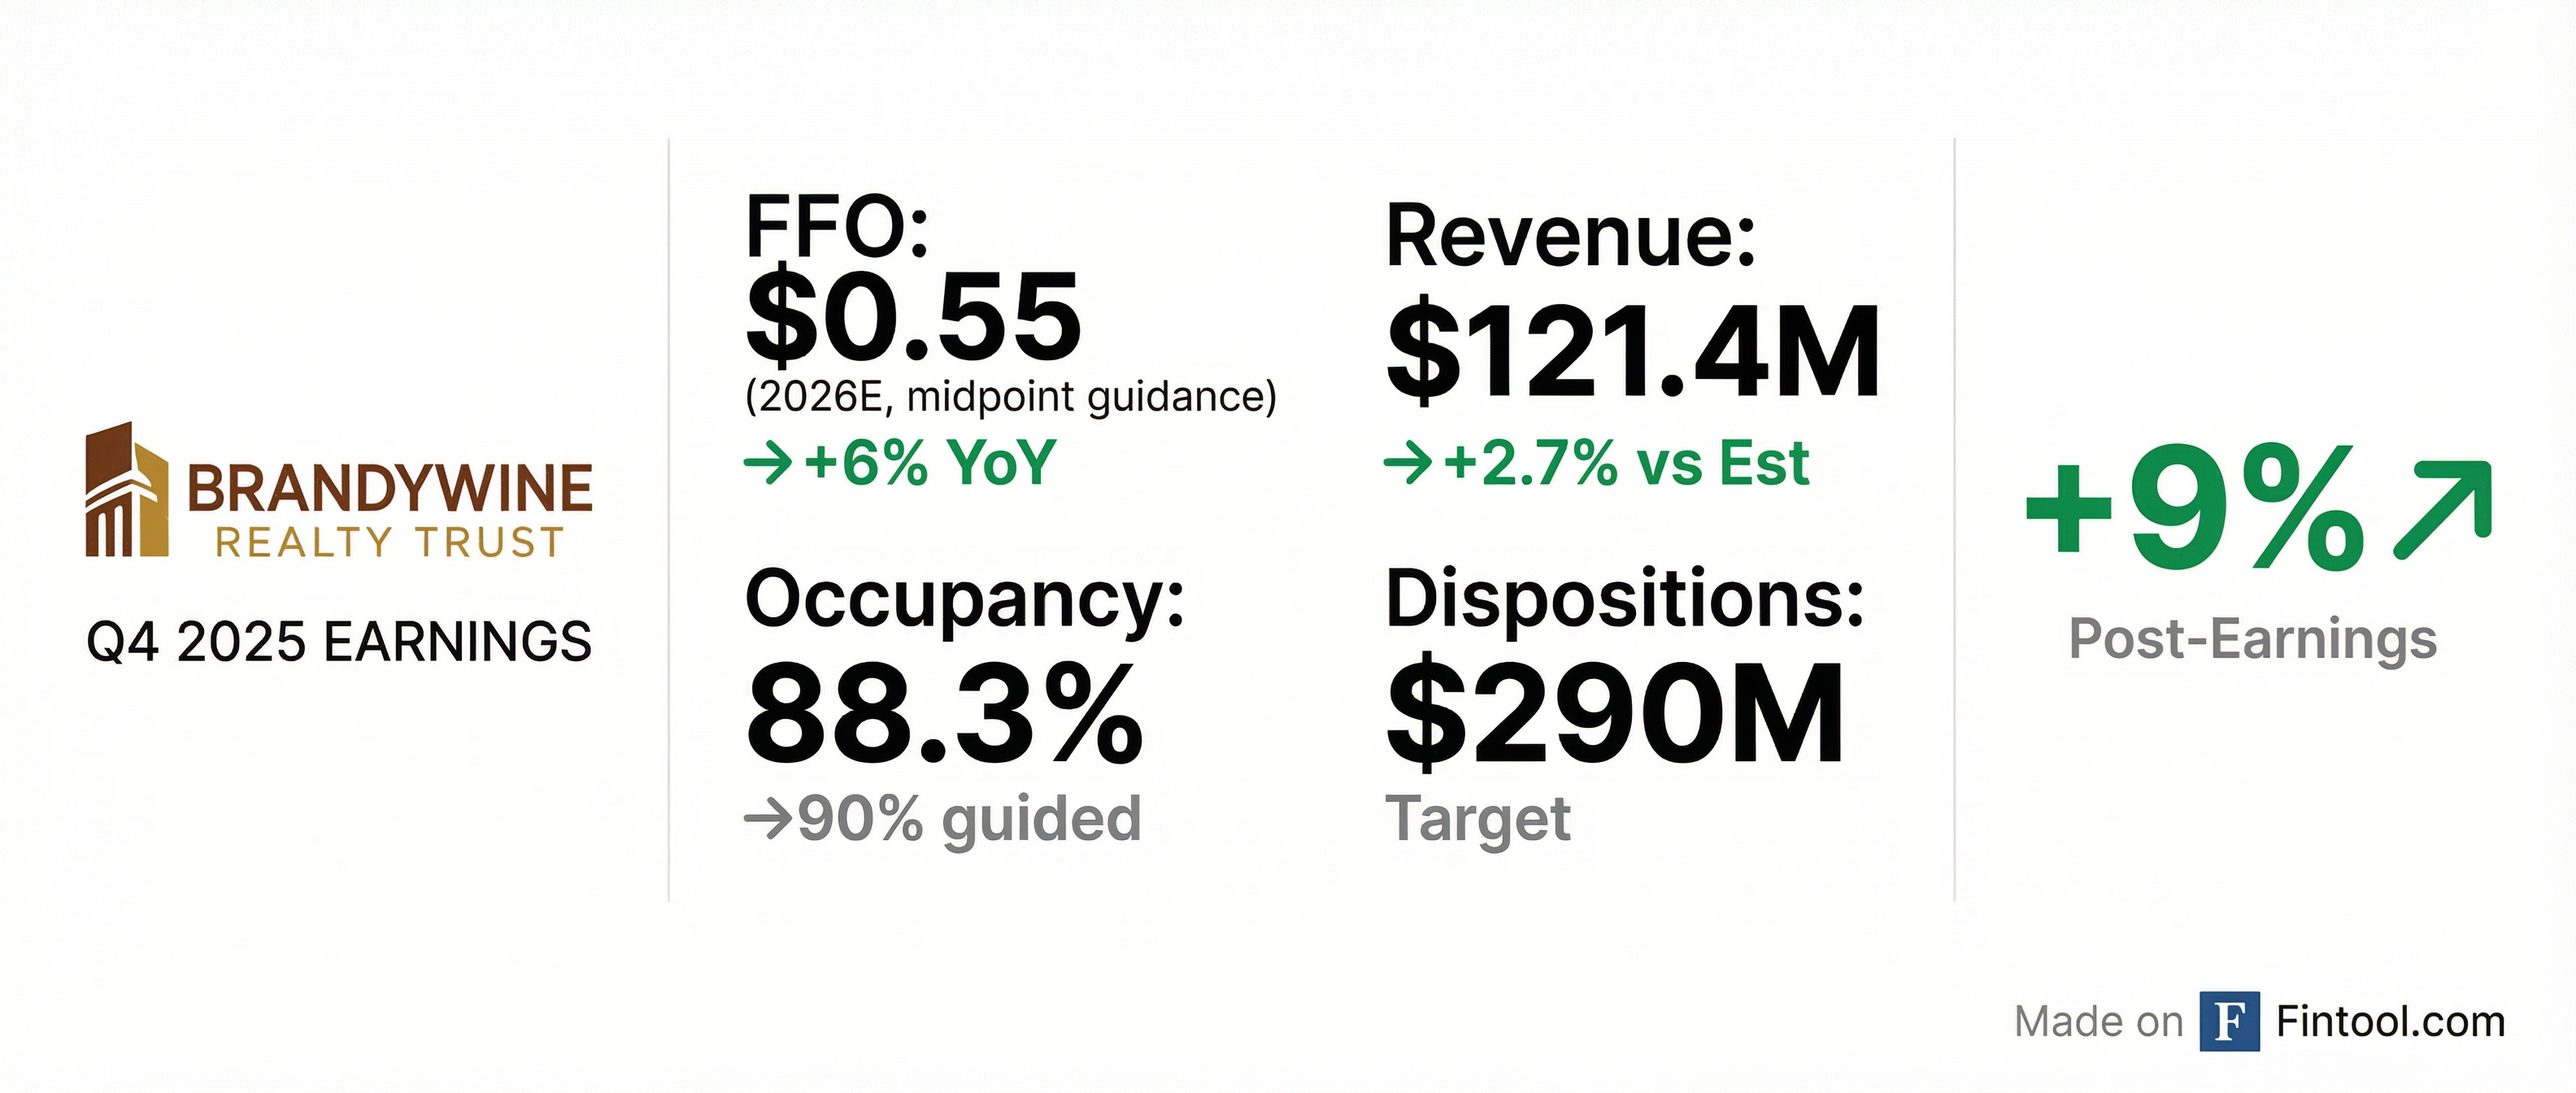
Brandywine Realty Trust shares surged 9% after Q4 2025 results topped revenue expectations and management outlined a clear deleveraging roadmap. Revenue of $121.4M beat consensus by 2.7%, while FFO of $0.08/share was depressed by a $12.2M ($0.07/share) loss on debt extinguishment. Excluding that one-time item, core FFO was $0.15/share. The Philadelphia-focused office REIT provided 2026 guidance of $0.51-$0.59 FFO/share, representing 5.8% growth at the midpoint. Perhaps more importantly, management committed to $280-300M of asset sales with proceeds going first to debt reduction—music to the ears of investors concerned about leverage.
Did Brandywine Beat Earnings?
Brandywine delivered a mixed quarter with revenue topping expectations but EPS reflecting significant real estate write-downs:
The net loss of $36.9M ($0.21/share) was driven by depreciation, impairments, and the debt extinguishment loss. For REITs, FFO is the more relevant profitability metric. Core FFO of $0.15/share (excluding capital market items) was down from $0.16/share in Q3 2025 and $0.17/share in Q4 2024.
Same Store Performance:
The company exceeded the high end of its same store guidance on a cash basis, reflecting solid execution on rent collections and lease renewals.
What Did Management Guide for 2026?
Brandywine provided detailed 2026 guidance with FFO expected to grow modestly despite higher interest expense:
2026 FFO Bridge (per share):
The guidance reflects consolidation of the 3025 JFK construction loan adding $0.06/share to interest expense, plus full-year impact of the June 2025 $150M bond tap ($0.03/share) and new C-PACE financing on 3151 Market ($0.03/share).
How Did the Stock React?
Brandywine shares jumped +9% on earnings day (February 4, 2026), rallying from $2.82 to ~$3.08 intraday, signaling investor approval of the 2026 guidance and capital allocation priorities.
The stock trades at a steep discount to book value of $4.41/share, reflecting investor concerns about office fundamentals and leverage. The rally suggests the market was positioned for worse news, and the clear deleveraging roadmap resonated with investors.
What Changed From Last Quarter?
Capital Structure Transformation: The most significant development was the recapitalization of development joint ventures:
-
3025 JFK Acquisition — Acquired partner's preferred equity for $70.5M in October 2025, consolidating the 200,000 SF office building (92% leased, 24% occupied) and $178M construction loan
-
3151 Market Acquisition — Acquired partner's preferred equity for $65.7M in December 2025, consolidating the 417,000 SF life science building (only 3% leased)
-
Debt Refinancing — Completed $300M unsecured bond offering at 6.125% due 2031, used proceeds to repay $245M secured term loan. Result: all wholly-owned assets now unencumbered
-
C-PACE Financing — Closed $50.5M C-PACE loan on 3151 Market at 7.31% with 28-year maturity
Leverage Increase: Net debt/EBITDA rose to 8.8x from 8.1x in Q3 2025, driven by the JV consolidations adding debt to the balance sheet.
Leasing Momentum and Tour Activity
One of the standout positives from the quarter was accelerating leasing activity, signaling improving office demand in Brandywine's core markets:
Conversion rates remain strong:
- 56% of tours converted to proposals
- 38% of proposals converted to executed leases
- Forward leasing commencing after year-end increased 26% to 229,000 sq ft
Philadelphia Market Share: Over the last 5 years, Brandywine captured 30% market share of all new leasing in Market West and University City—double their 15% property market share. In 2025, this accelerated to 54% of all new leasing.
CEO Jerry Sweeney noted: "Since 2021, our net effective rents in these submarkets have increased almost 20%, or an annual net effective rent increase of 5.4%."
Q&A Highlights: Capital Allocation and Strategy
Deleveraging First, Then Buybacks
When asked about the $125M earmarked for debt or share repurchases, CEO Sweeney was emphatic about priorities:
"Sales proceeds will be used first to reduce leverage, period. That's top priority... our primary objective of the asset sale program is to continue on that path back to investment-grade metrics. Stock buyback optionality comes into play as we achieve our other objectives."
Management targets investment-grade metrics: Fixed Charge Coverage "well north of two" and Net Debt/EBITDA in the "low to mid sevens."
Bond Refinancing Opportunity
Over 50% of outstanding bonds have coupons north of 8%. If refinanced at current market rates, interest costs would decrease approximately $0.10/share. The 2028 bonds (8.5% coupon) are trading at ~5.6% yield, suggesting attractive buyback economics.
Portfolio Strategy
When asked what to sell, Sweeney explained the framework:
"We took a hard look at what we forecast some of the growth rates to be on some of our assets, given changing sub-market dynamics... where we think we're gonna be treading economic water in some of these properties because of changes in sub-market conditions, we're taking a hard look at that."
Key focuses:
- Pennsylvania suburbs: Narrow to 1-2 core submarkets
- Austin: Shift attention to Uptown ATX development
- Washington D.C.: Rational exit from the marketplace
Austin Redevelopment Plans
With IBM rolling out of space at Uptown starting end of Q1 2026, management is evaluating redevelopment of a vacant 157,000 SF building:
- Renovation cost: $30-40M
- Timeline: 3-4 quarters
- Pricing: 15-20% below One Uptown rents
- Target yield: 8%+ cash yield
- Pipeline: 600,000 SF of prospects already identified
JV Recapitalization Timing
Management confirmed JV recaps (Solaris, One Uptown) are planned for second half of 2026, with potential upside for sooner execution:
"We would love to get those done sooner rather than later. But I think in the interest of being conservative, we didn't really factor in any of that impact into our earnings outlook for the year."
Strategic Direction and M&A
When asked about the persistent NAV discount (stock at ~$3 vs $8 consensus NAV), CEO Sweeney acknowledged the board reviews strategic direction quarterly:
"The board and management always have open door to any type of strategic solution... the operating portfolio remains in excellent shape. We're growing occupancy with positive absorption, with good capital control."
Leasing Activity and Occupancy
Leasing activity totaled 414,579 SF in Q4 2025 (including JV portfolio), with positive rental rate spreads:
Occupancy:
The 2.1% spread between occupancy (88.3%) and leased (90.4%) represents signed leases not yet commenced, providing visibility into near-term occupancy improvement.
Portfolio Vacancy Concentration
Company vacancy is concentrated in a handful of challenged properties:
Excluding these three properties, portfolio occupancy would be 91.6%. The Austin properties continue to weigh on results, with management exploring alternative uses including multifamily conversion enabled by Texas SB 840.
Life Sciences Strategy
Brandywine is positioning for growth in life sciences, currently 8% of the portfolio with a target of 25% pro forma for the development pipeline:
+Labs Incubator (Cira Centre):
- 50,000 SF incubator: 76% leased
- 54,717 SF graduate labs: 93% leased
Philadelphia Life Sciences Market Highlights:
- VC funding surged to $1.5B in 2025, up 48% YoY
- Vacancy rate of 15.9% vs. 22.7% national average
- 12% of global cell and gene therapy companies headquartered in Philadelphia
The 3151 Market development (417,000 SF life science building) remains the primary vehicle for life sciences growth, though it's only 3% leased currently.
Balance Sheet and Liquidity
The increase in debt reflects consolidation of the JV construction loans. All wholly-owned assets are now unencumbered following the secured term loan repayment.
2026 Debt Maturities: The primary near-term obligation is refinancing the $178M construction loan on 3025 JFK due July 2026.
Development Pipeline
One Uptown Update: Now 55% leased (up from 40% last quarter), with an additional 20,000 SF (8%) in leases out for execution, which would bring occupancy to 63%. Pipeline remains strong with tenant sizes ranging from 5,000 to 60,000 SF.
3151 Market Update: Pipeline stands at approximately 1 million SF, broken down to 60% office and 40% life science. Management noted discussions remain active with several key proposals outstanding.
Total development costs: $582.9M with $48.7M remaining equity to fund for wholly-owned projects.
Key Risks and Concerns
-
Elevated Leverage — Net debt/EBITDA of 8.8x is high for an office REIT in a challenging environment
-
Austin Exposure — Significant vacancy in Austin market with no near-term lease-up visibility
-
3151 Market Lease-Up — The 417,000 SF life science building is only 3% leased with stabilization targeted for Q4 2027
-
Higher Interest Costs — 2026 guidance reflects $0.12/share headwind from higher gross interest expense
-
Dividend Sustainability — CAD payout ratio of 127.8% for 2025 suggests the dividend may need to be revisited
Management Changes
EVP of Operations George Johnstone announced his retirement, with this being his final earnings call. CEO Sweeney thanked him for his "many years of outstanding service and many contributions."
Bottom Line
Brandywine delivered a revenue beat, exceeded same store NOI guidance, and the stock responded with a +9% rally — a welcome change for shareholders who've seen the stock fall nearly 50% from its 52-week high. The 2026 guidance of $0.51-$0.59 FFO/share represents modest 6% growth at the midpoint, but the real story is the deleveraging roadmap: $280-300M of asset sales targeting 8% cap rates, crisp focus on reducing leverage, and optionality for share buybacks as balance sheet improves.
The accelerating tour volume (+87% YoY) and Philadelphia market share (54% of all 2025 new leasing) suggest the flight-to-quality narrative is working. Execution on 3151 Market lease-up (1M SF pipeline) and Austin stabilization remain the key catalysts—or risks—heading into 2026.
Data sourced from Brandywine Realty Trust Q4 2025 Supplemental Information Package and Q4 2025 Earnings Call Transcript, published February 4, 2026.